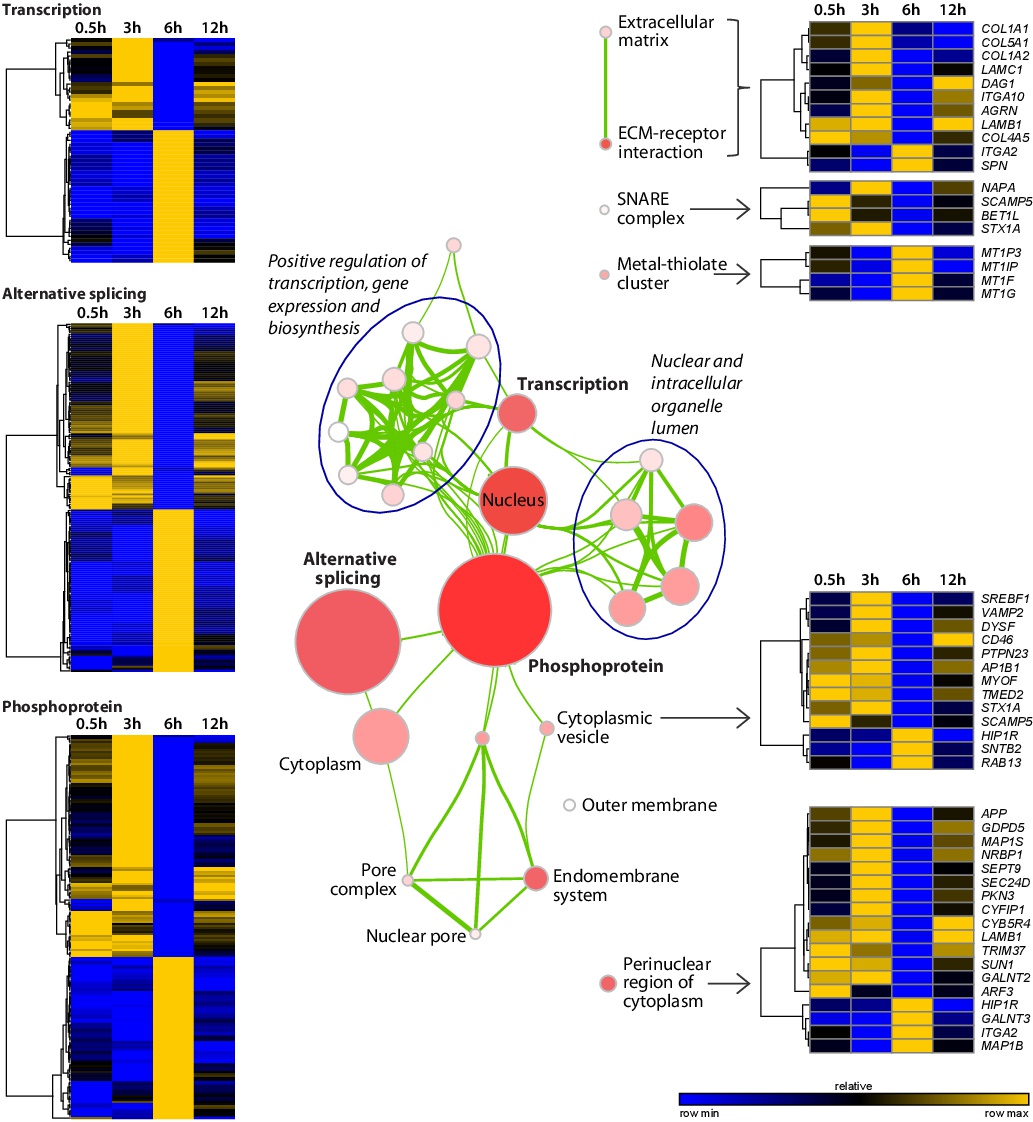
Fig. 7. Modules of co-regulated genes in migrating HAoECs upon MC1R activation. The enrichment map of modulated genes was drawn as a network of the most significant functionally annotated gene sets (p<0.01 and Benjamini FDR<0.20). Nodes represent gene sets. Node colour intensity is relative to enrichment significance, from lower (light) to higher (dark red). Node size is proportional to the gene set size. Gene sets are connected by green edges based on their similarity. Edge thickness measures the degree of the overlap between two gene sets (using a cut-off of the Jaccard plus Overlap combined coefficient = 0.375). Clusters of tightly, functionally related gene sets are circled and assigned an overall label. Heat maps of temporal expression patterns of relevant gene sets and pathways are displayed. Hierarchical clustering of genes was performed using one minus Pearson correlation distance and the average linkage method. Row normalized expression values are shown as a gradient colour ranging from lower (blue) to higher (gold) values.